![]()
![]()
![]()
![]()
|
Parent Topic |
|
|
|
|
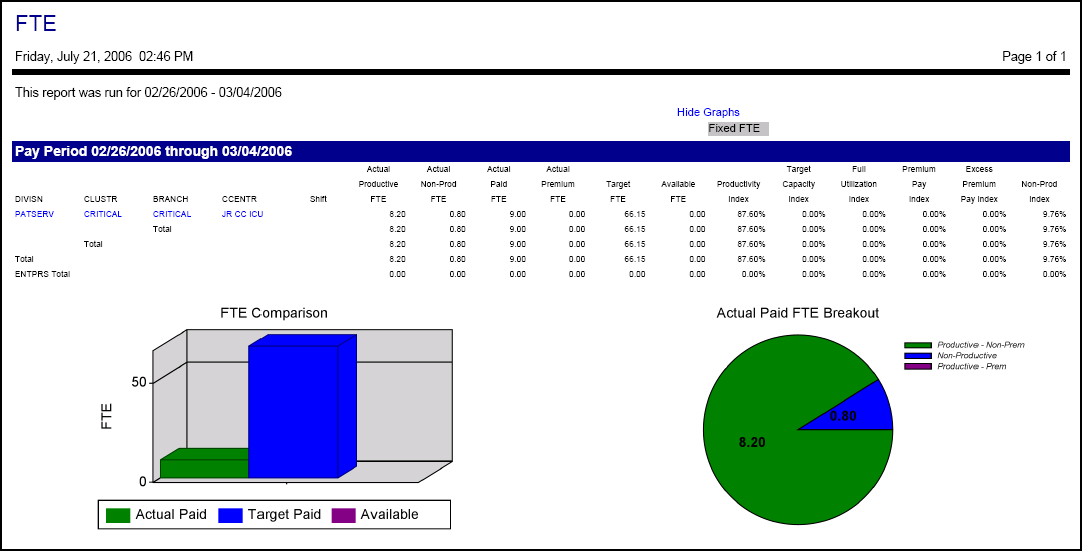
This report gives information regarding the productivity FTE (full time equivalent) values. The report compares Actual values to Target values and Available values. Calculated index percentages are also included.
The organization unit is specified in the set up screen, but the user can drill up or down (to higher or lower organization unit levels) by clicking on the Up or Down options within the report.
The values can be displayed for either days, weeks, pay periods, months or years. Within the report, the user can toggle between summary and detail values.
The Job Class parameter determines if the report can be drilled down to the Job Class (always, never) by clicking on the appropriate organization unit link within the report. If the parameter is set to Set Up, the system references the Productivity Standard 4 Indicator setting, in the Organization Unit General screen, to determine if the drill down is by productivity standard or by job class.
Report fields include the  Actual Productive FTEs, Actual Non-Productive FTEs, Actual Paid FTEs, Actual Premium FTEs, Target FTEs, Available FTEs, Productivity Index, Target Capacity Index, Full Utilization Index, Premium Pay Index, Excess Premium Pay Index, and Non-Productive Index.
The percentage of FTEs that were assigned non-productive hours during the reporting period, such as vacation or sick time.
Formula: (Non-Productive FTE / Productive FTE) * 100
The sum of the direct and indirect productive FTE values. This indicates the number of FTEs who actually worked.
Formula: Productive Direct FTE + Productive Indirect FTE
The number of FTEs working hours assigned to pay codes that are coded to be productive and indirect.
Formula: Productive Indirect Hours / FTE Hours Conversion
FTE hours / number of productive days in week) * number of productive days in reporting period.
Acronym for "full time equivalent". This compares the number of hours worked by employees to the value set for a full time employee. If the value for an FTE is set to 40 hours per week, then every 40 hours worked would equal 1.0 FTE.
For example, if several employees worked a total of 300 hours, this would be 7.5 FTEs, regardless of how many individual employees worked these 300 hours (300 / 40 = 7.5).
The number of hours which define the productivity FTE for the corporation are set up on the Configuration section > System card > Application screen. Enter "LBRVSN" in the Code field and Search. Open the Parameters tab.
Total of the hours assigned to pay codes where report assignment Productive Indirect Hours (Worked, and Paid) is set to Yes. These are shifts where the employee is not directly providing patient care (for example, maintenance, laundry, or education classes).
Formula: Productive Direct Hours / FTE Hours Conversion
FTE hours / number of productive days in week) * number of productive days in reporting period.
Acronym for "full time equivalent". This compares the number of hours worked by employees to the value set for a full time employee. If the value for an FTE is set to 40 hours per week, then every 40 hours worked would equal 1.0 FTE.
For example, if several employees worked a total of 300 hours, this would be 7.5 FTEs, regardless of how many individual employees worked these 300 hours (300 / 40 = 7.5).
The number of hours which define the productivity FTE for the corporation are set up on the Configuration section > System card > Application screen. Enter "LBRVSN" in the Code field and Search. Open the Parameters tab.
Total of the hours assigned to pay codes where report assignment Productive Direct Hours (Direct, Worked, and Paid) is set to Yes and where neither the job class nor any special codes are set to be Indirect. These are shifts where the employee is directly providing patient care (for example, RN or LPN).
The hours are considered to be direct when ALL of the following are true:
The number of FTEs working non-productive hours.
Formula: Non-Productive Hours / FTE Hours Conversion
FTE hours / number of productive days in week) * number of productive days in reporting period.
Acronym for "full time equivalent". This compares the number of hours worked by employees to the value set for a full time employee. If the value for an FTE is set to 40 hours per week, then every 40 hours worked would equal 1.0 FTE.
For example, if several employees worked a total of 300 hours, this would be 7.5 FTEs, regardless of how many individual employees worked these 300 hours (300 / 40 = 7.5).
The number of hours which define the productivity FTE for the corporation are set up on the Configuration section > System card > Application screen. Enter "LBRVSN" in the Code field and Search. Open the Parameters tab.
Total of the hours assigned to pay codes where report assignment Non-Productive Hours (Paid) is set to Yes. Non-productive hours are usually associated with paid time off, such as sick time, vacation, jury duty, etc.
Shows the percentage of staff who were paid premium pay (such as overtime) that could have been prevented by assigning shifts to underutilized staff.
Formula: Full Utilization Index - Premium Pay Index
Determines the percentage of staff who were paid premium (higher cost) pay.
Formula: (Premium FTE / Productive FTE) * 100
The sum of the direct and indirect productive FTE values. This indicates the number of FTEs who actually worked.
Formula: Productive Direct FTE + Productive Indirect FTE
The number of FTEs working hours assigned to pay codes that are coded to be productive and indirect.
Formula: Productive Indirect Hours / FTE Hours Conversion
FTE hours / number of productive days in week) * number of productive days in reporting period.
Acronym for "full time equivalent". This compares the number of hours worked by employees to the value set for a full time employee. If the value for an FTE is set to 40 hours per week, then every 40 hours worked would equal 1.0 FTE.
For example, if several employees worked a total of 300 hours, this would be 7.5 FTEs, regardless of how many individual employees worked these 300 hours (300 / 40 = 7.5).
The number of hours which define the productivity FTE for the corporation are set up on the Configuration section > System card > Application screen. Enter "LBRVSN" in the Code field and Search. Open the Parameters tab.
Total of the hours assigned to pay codes where report assignment Productive Indirect Hours (Worked, and Paid) is set to Yes. These are shifts where the employee is not directly providing patient care (for example, maintenance, laundry, or education classes).
Formula: Productive Direct Hours / FTE Hours Conversion
FTE hours / number of productive days in week) * number of productive days in reporting period.
Acronym for "full time equivalent". This compares the number of hours worked by employees to the value set for a full time employee. If the value for an FTE is set to 40 hours per week, then every 40 hours worked would equal 1.0 FTE.
For example, if several employees worked a total of 300 hours, this would be 7.5 FTEs, regardless of how many individual employees worked these 300 hours (300 / 40 = 7.5).
The number of hours which define the productivity FTE for the corporation are set up on the Configuration section > System card > Application screen. Enter "LBRVSN" in the Code field and Search. Open the Parameters tab.
Total of the hours assigned to pay codes where report assignment Productive Direct Hours (Direct, Worked, and Paid) is set to Yes and where neither the job class nor any special codes are set to be Indirect. These are shifts where the employee is directly providing patient care (for example, RN or LPN).
The hours are considered to be direct when ALL of the following are true:
The FTEs receiving premium (higher cost) pay.
Formula: Premium Hours / FTE Hours Conversion
FTE hours / number of productive days in week) * number of productive days in reporting period.
Acronym for "full time equivalent". This compares the number of hours worked by employees to the value set for a full time employee. If the value for an FTE is set to 40 hours per week, then every 40 hours worked would equal 1.0 FTE.
For example, if several employees worked a total of 300 hours, this would be 7.5 FTEs, regardless of how many individual employees worked these 300 hours (300 / 40 = 7.5).
The number of hours which define the productivity FTE for the corporation are set up on the Configuration section > System card > Application screen. Enter "LBRVSN" in the Code field and Search. Open the Parameters tab.
Total of the hours assigned to pay codes where report assignment Premium Pay is set to Yes. These are shifts that are awarded premium (higher cost) pay.
This value determines how much of the available staff was used. Ideal utilization is 100%. Less than 100% means all available staff wasn't used; more than 100% means staff was over used.
Formula: ((Available FTE - Paid FTE) / Available FTE) * 100
Formula: ((Available FTE - Target Paid FTE) / Available FTE) * 100
Formula: ((Target FTE - Productive FTE) / Target FTE) * 100
The number of FTE's configured for the productivity standard or job class/position.
Acronym for "full time equivalent". This compares the number of hours worked by employees to the value set for a full time employee. If the value for an FTE is set to 40 hours per week, then every 40 hours worked would equal 1.0 FTE.
For example, if several employees worked a total of 300 hours, this would be 7.5 FTEs, regardless of how many individual employees worked these 300 hours (300 / 40 = 7.5).
The number of hours which define the productivity FTE for the corporation are set up on the Configuration section > System card > Application screen. Enter "LBRVSN" in the Code field and Search. Open the Parameters tab.
The number of FTEs required for the volume of work.
Acronym for "full time equivalent". This compares the number of hours worked by employees to the value set for a full time employee. If the value for an FTE is set to 40 hours per week, then every 40 hours worked would equal 1.0 FTE.
For example, if several employees worked a total of 300 hours, this would be 7.5 FTEs, regardless of how many individual employees worked these 300 hours (300 / 40 = 7.5).
The number of hours which define the productivity FTE for the corporation are set up on the Configuration section > System card > Application screen. Enter "LBRVSN" in the Code field and Search. Open the Parameters tab.
Formula: Target Hours / FTE Hours Conversion
FTE hours / number of productive days in week) * number of productive days in reporting period.
Acronym for "full time equivalent". This compares the number of hours worked by employees to the value set for a full time employee. If the value for an FTE is set to 40 hours per week, then every 40 hours worked would equal 1.0 FTE.
For example, if several employees worked a total of 300 hours, this would be 7.5 FTEs, regardless of how many individual employees worked these 300 hours (300 / 40 = 7.5).
The number of hours which define the productivity FTE for the corporation are set up on the Configuration section > System card > Application screen. Enter "LBRVSN" in the Code field and Search. Open the Parameters tab.
The number of hours required to complete the volume of work.
Formula: Actual Volume / Units per Hour Standard
The number of productivity units that should be accomplished in an hour. For example, if the productivity unit is for lab tests, and this standard is set to 4, lab technicians are expected to conduct 4 tests every hour.
The standard for a particular type of productivity units is set up on the Configuration section> Productivity card> Productivities screen> Standards section.
The units of service that were performed, normalized over the number of days in the range.
-or- Actual Volume * Hours Per Unit Standard
The number of hours that it should take to accomplish one productivity unit. For example, if the productivity unit is for lab tests, and this standard is set to .25, lab technicians are expected to conduct 1 test every .25 hour (15 minutes).
The FTEs receiving premium (higher cost) pay.
Formula: Premium Hours / FTE Hours Conversion
FTE hours / number of productive days in week) * number of productive days in reporting period.
Acronym for "full time equivalent". This compares the number of hours worked by employees to the value set for a full time employee. If the value for an FTE is set to 40 hours per week, then every 40 hours worked would equal 1.0 FTE.
For example, if several employees worked a total of 300 hours, this would be 7.5 FTEs, regardless of how many individual employees worked these 300 hours (300 / 40 = 7.5).
The number of hours which define the productivity FTE for the corporation are set up on the Configuration section > System card > Application screen. Enter "LBRVSN" in the Code field and Search. Open the Parameters tab.
Total of the hours assigned to pay codes where report assignment Premium Pay is set to Yes. These are shifts that are awarded premium (higher cost) pay.
The sum of the paid hours for the FTEs, including the productive and non-productive hours.
Formula: Productive FTE + Non-Productive FTE
The number of FTEs working non-productive hours.
Formula: Non-Productive Hours / FTE Hours Conversion
FTE hours / number of productive days in week) * number of productive days in reporting period.
Acronym for "full time equivalent". This compares the number of hours worked by employees to the value set for a full time employee. If the value for an FTE is set to 40 hours per week, then every 40 hours worked would equal 1.0 FTE.
For example, if several employees worked a total of 300 hours, this would be 7.5 FTEs, regardless of how many individual employees worked these 300 hours (300 / 40 = 7.5).
The number of hours which define the productivity FTE for the corporation are set up on the Configuration section > System card > Application screen. Enter "LBRVSN" in the Code field and Search. Open the Parameters tab.
Total of the hours assigned to pay codes where report assignment Non-Productive Hours (Paid) is set to Yes. Non-productive hours are usually associated with paid time off, such as sick time, vacation, jury duty, etc.
The sum of the direct and indirect productive FTE values. This indicates the number of FTEs who actually worked.
Formula: Productive Direct FTE + Productive Indirect FTE
The number of FTEs working hours assigned to pay codes that are coded to be productive and indirect.
Formula: Productive Indirect Hours / FTE Hours Conversion
FTE hours / number of productive days in week) * number of productive days in reporting period.
Acronym for "full time equivalent". This compares the number of hours worked by employees to the value set for a full time employee. If the value for an FTE is set to 40 hours per week, then every 40 hours worked would equal 1.0 FTE.
For example, if several employees worked a total of 300 hours, this would be 7.5 FTEs, regardless of how many individual employees worked these 300 hours (300 / 40 = 7.5).
The number of hours which define the productivity FTE for the corporation are set up on the Configuration section > System card > Application screen. Enter "LBRVSN" in the Code field and Search. Open the Parameters tab.
Total of the hours assigned to pay codes where report assignment Productive Indirect Hours (Worked, and Paid) is set to Yes. These are shifts where the employee is not directly providing patient care (for example, maintenance, laundry, or education classes).
Formula: Productive Direct Hours / FTE Hours Conversion
FTE hours / number of productive days in week) * number of productive days in reporting period.
Acronym for "full time equivalent". This compares the number of hours worked by employees to the value set for a full time employee. If the value for an FTE is set to 40 hours per week, then every 40 hours worked would equal 1.0 FTE.
For example, if several employees worked a total of 300 hours, this would be 7.5 FTEs, regardless of how many individual employees worked these 300 hours (300 / 40 = 7.5).
The number of hours which define the productivity FTE for the corporation are set up on the Configuration section > System card > Application screen. Enter "LBRVSN" in the Code field and Search. Open the Parameters tab.
Total of the hours assigned to pay codes where report assignment Productive Direct Hours (Direct, Worked, and Paid) is set to Yes and where neither the job class nor any special codes are set to be Indirect. These are shifts where the employee is directly providing patient care (for example, RN or LPN).
The hours are considered to be direct when ALL of the following are true:
When the Show Graphs parameter is set to Yes, a bar graph compares Actual Paid, Target Paid and Available FTE information. A pie chart depicts Actual Paid FTE Breakout by Productive - Non-Premium, Non-Productive, and Productive-Premium.
The number of FTE's configured for the productivity standard or job class/position.
Acronym for "full time equivalent". This compares the number of hours worked by employees to the value set for a full time employee. If the value for an FTE is set to 40 hours per week, then every 40 hours worked would equal 1.0 FTE.
For example, if several employees worked a total of 300 hours, this would be 7.5 FTEs, regardless of how many individual employees worked these 300 hours (300 / 40 = 7.5).
The number of hours which define the productivity FTE for the corporation are set up on the Configuration section > System card > Application screen. Enter "LBRVSN" in the Code field and Search. Open the Parameters tab.
The targeted amount of pay, based on the staffing needs plus non-productive pay (such as vacation or sick).
Formula: Target FTE + Non-Productive FTE
The number of FTEs working non-productive hours.
Formula: Non-Productive Hours / FTE Hours Conversion
FTE hours / number of productive days in week) * number of productive days in reporting period.
Acronym for "full time equivalent". This compares the number of hours worked by employees to the value set for a full time employee. If the value for an FTE is set to 40 hours per week, then every 40 hours worked would equal 1.0 FTE.
For example, if several employees worked a total of 300 hours, this would be 7.5 FTEs, regardless of how many individual employees worked these 300 hours (300 / 40 = 7.5).
The number of hours which define the productivity FTE for the corporation are set up on the Configuration section > System card > Application screen. Enter "LBRVSN" in the Code field and Search. Open the Parameters tab.
Total of the hours assigned to pay codes where report assignment Non-Productive Hours (Paid) is set to Yes. Non-productive hours are usually associated with paid time off, such as sick time, vacation, jury duty, etc.
The number of FTEs required for the volume of work.
Acronym for "full time equivalent". This compares the number of hours worked by employees to the value set for a full time employee. If the value for an FTE is set to 40 hours per week, then every 40 hours worked would equal 1.0 FTE.
For example, if several employees worked a total of 300 hours, this would be 7.5 FTEs, regardless of how many individual employees worked these 300 hours (300 / 40 = 7.5).
The number of hours which define the productivity FTE for the corporation are set up on the Configuration section > System card > Application screen. Enter "LBRVSN" in the Code field and Search. Open the Parameters tab.
Formula: Target Hours / FTE Hours Conversion
FTE hours / number of productive days in week) * number of productive days in reporting period.
Acronym for "full time equivalent". This compares the number of hours worked by employees to the value set for a full time employee. If the value for an FTE is set to 40 hours per week, then every 40 hours worked would equal 1.0 FTE.
For example, if several employees worked a total of 300 hours, this would be 7.5 FTEs, regardless of how many individual employees worked these 300 hours (300 / 40 = 7.5).
The number of hours which define the productivity FTE for the corporation are set up on the Configuration section > System card > Application screen. Enter "LBRVSN" in the Code field and Search. Open the Parameters tab.
The number of hours required to complete the volume of work.
Formula: Actual Volume / Units per Hour Standard
The number of productivity units that should be accomplished in an hour. For example, if the productivity unit is for lab tests, and this standard is set to 4, lab technicians are expected to conduct 4 tests every hour.
The standard for a particular type of productivity units is set up on the Configuration section> Productivity card> Productivities screen> Standards section.
The units of service that were performed, normalized over the number of days in the range.
-or- Actual Volume * Hours Per Unit Standard
The number of hours that it should take to accomplish one productivity unit. For example, if the productivity unit is for lab tests, and this standard is set to .25, lab technicians are expected to conduct 1 test every .25 hour (15 minutes).
The sum of the paid hours for the FTEs, including the productive and non-productive hours.
Formula: Productive FTE + Non-Productive FTE
The number of FTEs working non-productive hours.
Formula: Non-Productive Hours / FTE Hours Conversion
FTE hours / number of productive days in week) * number of productive days in reporting period.
Acronym for "full time equivalent". This compares the number of hours worked by employees to the value set for a full time employee. If the value for an FTE is set to 40 hours per week, then every 40 hours worked would equal 1.0 FTE.
For example, if several employees worked a total of 300 hours, this would be 7.5 FTEs, regardless of how many individual employees worked these 300 hours (300 / 40 = 7.5).
The number of hours which define the productivity FTE for the corporation are set up on the Configuration section > System card > Application screen. Enter "LBRVSN" in the Code field and Search. Open the Parameters tab.
Total of the hours assigned to pay codes where report assignment Non-Productive Hours (Paid) is set to Yes. Non-productive hours are usually associated with paid time off, such as sick time, vacation, jury duty, etc.
The sum of the direct and indirect productive FTE values. This indicates the number of FTEs who actually worked.
Formula: Productive Direct FTE + Productive Indirect FTE
The number of FTEs working hours assigned to pay codes that are coded to be productive and indirect.
Formula: Productive Indirect Hours / FTE Hours Conversion
FTE hours / number of productive days in week) * number of productive days in reporting period.
Acronym for "full time equivalent". This compares the number of hours worked by employees to the value set for a full time employee. If the value for an FTE is set to 40 hours per week, then every 40 hours worked would equal 1.0 FTE.
For example, if several employees worked a total of 300 hours, this would be 7.5 FTEs, regardless of how many individual employees worked these 300 hours (300 / 40 = 7.5).
The number of hours which define the productivity FTE for the corporation are set up on the Configuration section > System card > Application screen. Enter "LBRVSN" in the Code field and Search. Open the Parameters tab.
Total of the hours assigned to pay codes where report assignment Productive Indirect Hours (Worked, and Paid) is set to Yes. These are shifts where the employee is not directly providing patient care (for example, maintenance, laundry, or education classes).
Formula: Productive Direct Hours / FTE Hours Conversion
FTE hours / number of productive days in week) * number of productive days in reporting period.
Acronym for "full time equivalent". This compares the number of hours worked by employees to the value set for a full time employee. If the value for an FTE is set to 40 hours per week, then every 40 hours worked would equal 1.0 FTE.
For example, if several employees worked a total of 300 hours, this would be 7.5 FTEs, regardless of how many individual employees worked these 300 hours (300 / 40 = 7.5).
The number of hours which define the productivity FTE for the corporation are set up on the Configuration section > System card > Application screen. Enter "LBRVSN" in the Code field and Search. Open the Parameters tab.
Total of the hours assigned to pay codes where report assignment Productive Direct Hours (Direct, Worked, and Paid) is set to Yes and where neither the job class nor any special codes are set to be Indirect. These are shifts where the employee is directly providing patient care (for example, RN or LPN).
The hours are considered to be direct when ALL of the following are true:
Today's date is used for determining the appropriate version of any Productivity Standards to be used for processing the report.
Report parameters include the following options: